Creating an infographic on a tight budget requires careful planning, use of free design tools, simplicity, repurposing existing visuals, creative data representation, and seeking feedback for iteration.
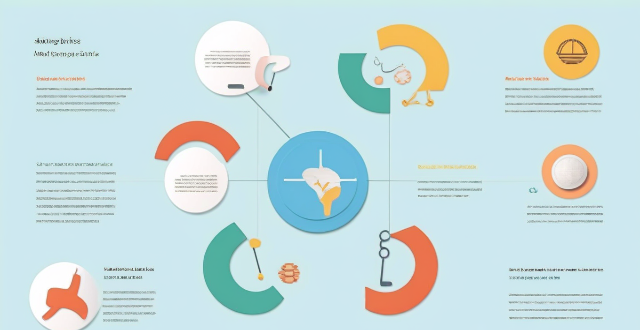
Tips for Creating an Infographic on a Tight Budget
1. Plan Your Content Carefully
Before you start designing your infographic, it's essential to plan your content carefully. This will help you identify the key points you want to convey and ensure that your infographic is focused and easy to understand. Here are some tips for planning your content:
- Identify your target audience: Who are you creating the infographic for? What do they already know about the topic? What information do they need?
- Determine the main message: What is the most important point you want to convey? Make sure this message is clear and prominent in your infographic.
- Choose relevant data and statistics: Select only the most important data and statistics to support your main message. Avoid including too much information, as this can overwhelm your audience.
2. Use Free Design Tools
There are many free design tools available online that can help you create professional-looking infographics without breaking the bank. Some popular options include:
- Canva: A user-friendly design tool with a wide range of templates and design elements.
- Piktochart: A more advanced design tool with a variety of customizable templates and charts.
- Google Charts: A simple tool for creating basic charts and graphs.
3. Keep It Simple
When working with a tight budget, it's important to keep your infographic simple and focused. Here are some tips for simplifying your design:
- Use a limited color palette: Stick to two or three colors that complement each other well.
- Choose legible fonts: Use clear, easy-to-read fonts that are appropriate for your audience.
- Avoid clutter: Don't try to include too much information in your infographic. Stick to the most important points and use whitespace effectively.
4. Repurpose Existing Visuals
If you have existing visuals, such as charts or graphs, consider repurposing them for your infographic. This can save time and money while still providing valuable information to your audience. Just make sure the visuals are high-quality and relevant to your main message.
5. Get Creative with Data Representation
Instead of relying solely on text to convey information, get creative with how you represent data in your infographic. Here are some ideas:
- Use icons and symbols: These can be used to represent different categories or ideas within your infographic.
- Create custom illustrations: If you have some artistic skills, consider creating your own illustrations to add personality to your infographic.
- Incorporate interactive elements: If possible, include interactive elements like clickable links or hover effects to engage your audience further.
6. Seek Feedback and Iterate
Once you've created your initial draft, seek feedback from others to ensure that your infographic is effective and easy to understand. Make any necessary adjustments based on their feedback, and continue refining your design until it meets your goals.